

Key Takeaways
|
A lot of teams think they’re further along with AIOps because they’ve already automated parts of incident response.
A server goes down, the system sends a restart command, and the team moves on. But the command may fail. The service may come back without anyone checking the user experience. The incident ticket may stay open.
I’ve seen engineers spend Fridays closing dozens of tickets that automation opened during the week but never closed.
The same thing happens with triage. Everyone knows which engineer handles which type of failure, but that knowledge may never make it into the documentation or knowledge base the AI can use. The team has a process, but parts of it still depend on people filling in the gaps.
That makes AIOps readiness harder to judge than it looks.
An environment may already automate actions while experienced engineers still fill in the gaps that make those actions work.
When Engineer Expertise Masks Your Observability Gaps
Experienced engineers can make an environment’s observability look more mature than it is because they compensate for context that isn’t captured or consistently represented.
For example, I once saw an environment where servers had to be shut down and restarted in a specific order. One server had to come completely out of the load balancer before the team moved on. The process worked because the engineers knew the sequence from experience.
You see the same problem with judgment. One engineer may see a service come back in two seconds and call it healthy. Another may give it four or five seconds because they know it’s still warming up. At 2 a.m., three seconds might be acceptable. At 10 a.m., it might not be.
Those decisions depend on tribal knowledge, business context, and hidden dependencies that may never be represented in the environment. As long as experienced engineers fill the gaps, the system can appear stable and mature.
The weakness becomes much more obvious when the engineer changes.
At a major enterprise, two engineers had learned that a specific error pattern in the logs meant part of the environment would likely fail within 30 to 45 minutes. They knew to pause the service, remove it from the load balancer, and restart one server. Other engineers didn’t recognize the pattern, and the wider environment could be down for two or three hours.
The observability environment hadn’t changed.
The difference was how much context the engineer brought. A machine doesn’t bring years of pattern recognition or tribal knowledge to the incident.
If the environment only works reliably because the right engineer knows what the signals mean, it isn’t ready for AIOps to interpret them on its own.
More Telemetry Doesn’t Give AIOps More Understanding
You can detect an issue within a minute and still spend 30 minutes figuring out the root cause. The team sees that this happened here and that happened there, but they don’t know whether one caused the other. That’s correlation, not causation.
The signals can also disagree.
A metric says the system is healthy, the logs show errors, and the traces show latency spikes.
Sampling makes that harder. You may have complete metrics but only part of the logs or traces. Or your metrics are in Prometheus, your logs are in Elastic, and your traces are in another APM tool. Now you’ve got three toolsets and sometimes three engineers trying to stitch together the same problem.
That’s how teams end up with hundreds of alerts a day and only review a handful. They start depending on the NOC or a customer complaint to tell them which signal actually mattered.
They have plenty of data, but they can’t reliably find the signal in the noise.
You see the same problem when teams automate a service restart and celebrate because nobody got called at 2 a.m., 4 a.m., or 6 a.m. A few weeks later, the service is still failing three times every night. The automation fixed the symptom, but nobody had answered why it kept happening.
For AIOps, more telemetry isn’t enough. The signals have to give the system a consistent, trustworthy picture of what’s happening and why.
Human Context Has to Become Machine-Usable Context
Once AIOps starts correlating, diagnosing, or acting, the system needs access to the context engineers used to supply themselves.
A web application may slow down while infrastructure shows 99% memory. That makes infrastructure look like the cause. But the real cause may be a deployment from the night before that introduced a new database call and drove memory usage up.
Without the deployment context, the system can only correlate slow performance with high memory. With it, the system can trace the change that caused the spike and point the response toward the right team.
Historical baselines matter too. “Nothing broke” isn’t enough to call a deployment successful. You need to know how the environment performed before the change so you can see what improved, what degraded, and what normal looks like.
Before teams can trust AIOps to interpret those signals, the system needs reliable root-cause analysis, business criticality, dependency mapping, and a feedback loop. It needs to know what caused the issue, what else it affected, what matters most to the business, and whether the response worked.
That can mean letting Dynatrace identify the same root cause several times before the team stops verifying it manually. The team may then test the response in PowerShell or Python before moving it into Ansible once they trust both the diagnosis and the action.
From there, Dynatrace can confirm recovery while Ansible handles the remediation and follow-up checks.
Assessing Whether Your Observability Is Ready for AIOps
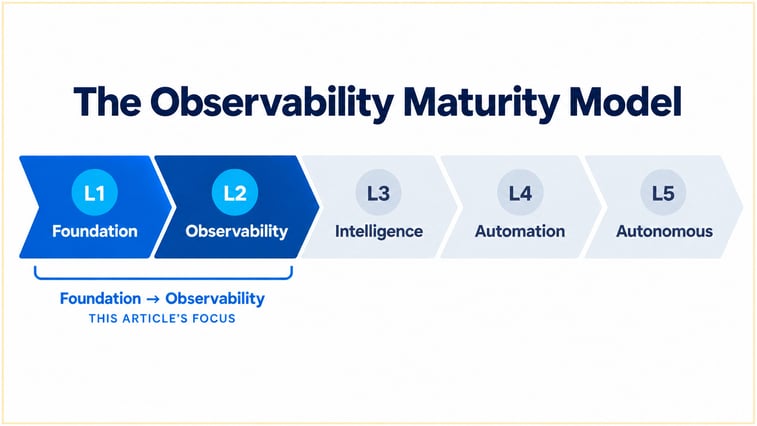
At Arctiq, we use the Observability Maturity Model to separate what the environment knows from what engineers still supply and identify what has to change next.
Here’s our process.
Assess How the Team Handles Incidents Today
We start by interviewing the engineers to see what happens when an application goes down:
- What alerted them?
- Which tools did they check?
- Which teams did they call?
- How did they find the root cause?
- What did they have to verify manually?
- What did they know from experience that the tools didn’t tell them?
Then we go back through incidents from the last four to six months and look at what happened.
The same latency might come from a deployment or from a seasonal influx of users during Black Friday or a tax-free weekend. Engineers may know that difference from experience even when the environment doesn’t.
That business context matters if you expect AIOps to tell the difference.
Place the Application Based on What the Team Still Has to Do
The OMM is a blueprint. Levels can overlap, and an application can be in crawl, walk, or run within each level.
If the team diagnoses and fixes everything manually, the application is still crawling. If a script already exists but an engineer has to confirm the root cause, trigger it, and double-check the result, it may be walking.
The blocker may not be technology.
A team may refuse to trust its APM data until someone checks logs owned by another group. AIOps readiness is always about people, process, and technology. You can have the tools and approvals in place, but if engineers don’t trust the data or understand why automation is needed, they can still block the next step.
Validate the Data Before Automating the Response
Before moving an application forward, we check whether the observability data holds up:
- Can you trace an incident to the root cause consistently?
- Do teams mean the same thing when they talk about latency, duration, or response time?
- Do you have historical baselines for what normal looks like?
- Are sampling and alert noise hiding the signal?
Then validate the platform against the ground truth your engineers know today. Make sure it identifies the root cause consistently and continues to monitor the environment reliably under load.
Operational readiness matters too. Development and operations need a feedback loop when a deployment improves or breaks production. Teams need access to the data they depend on. The business needs to know the cost and risk of downtime.
Once the team trusts the diagnosis, it can start automating responses based on Dynatrace’s diagnose. Red Hat Ansible may already be in the environment. We sometimes find another team already using Ansible for scripts while operations doesn’t realize it can use the same platform for remediation.
Before moving to end-to-end automation, connect observability to service management and work through the approval process. Some actions may still need approval. Others may eventually qualify for preapproval.
Move Each Application at Its Own Pace
Catalog search and user login may be ready for more automation, while credit-card validation needs more controls because of security, compliance, or approval requirements. One part of the same website can move ahead while another lags behind.
We use the OMM to establish where each application is today, close the gaps blocking the next step, and move it from crawl to walk to run as the data and response become reliable.
You know you’re moving toward AIOps readiness when the team can trust the data and the root cause enough to let the system handle more of the response without an engineer having to double-check every step.
Is Your Observability Ready for AIOps?
Before advancing toward automated remediation, understand where your applications stand today. Use Arctiq's 15-point Autonomous Operations Readiness Assessment to identify gaps across observability, intelligence, and automation, and determine where to focus next.
For organizations ready to take the next step, connect with Arctiq to explore how Dynatrace and Red Hat Ansible Automation Platform can support your journey toward autonomous operations.
